Monday, October 26, 2015

THE MOST UNDERVALUED COMMODITY ON THE BOARD

POST 4 - THE MOST UNDERVALUED COMMODITY ON THE BOARD

....is Aluminum! Here's a long term graph of the price in 2015$:


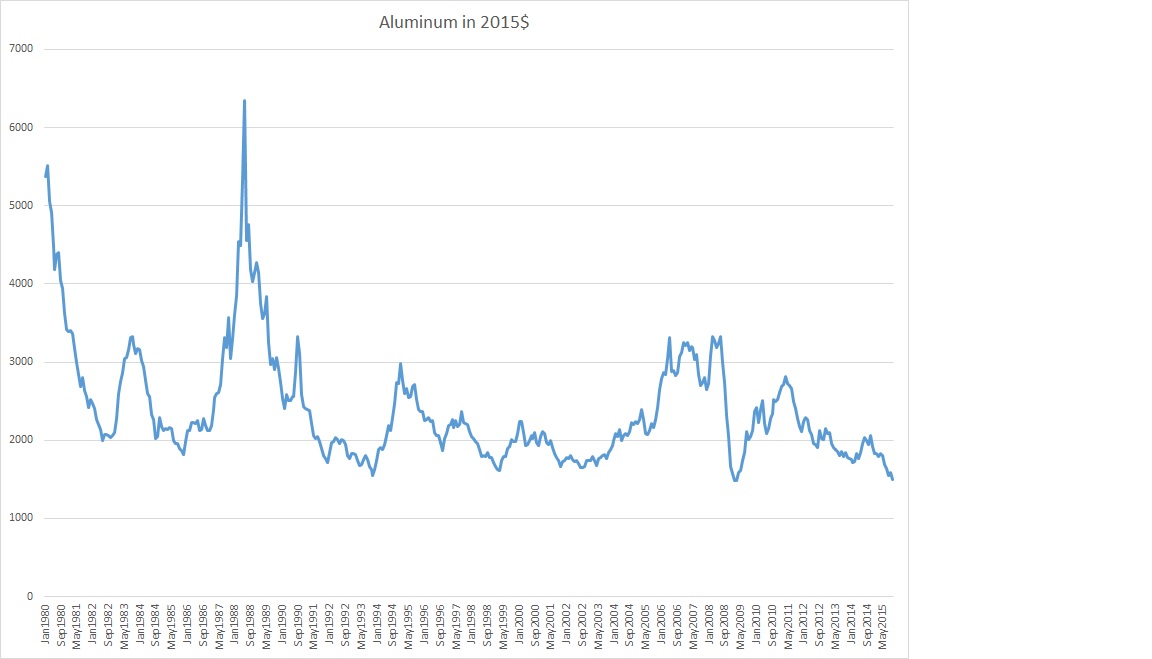
So aluminum is just about at all time record lows!

Now there is a good reason for this. In a word, China. The Chinese investment bubble of the past 20 years was truly incredible, on the order of the Japanese property bubble of the 1980s. A lot of the overbuilding went into capital intensive areas, like aluminum smelters. Additionally, there was huge overbuilding in construction and infrastructure, areas that use a fair bit of aluminum. So when China started decelerating last year, there was both an increase in supply and a decrease in demand.

Here's a graph of aluminum production that shows the Chinese effect very clearly. The data is only through Jan of 2015, but I understand that the trend has continued. Note how Chinese production has accelerated as ROW production slightly declined:


To my mind, the oversupply will last quite awhile. The Chinese are not likely to reduce production. In fact there are some new smelters due to come onstream in western China. The large state owned industries in China make production decisions on noneconomic issues, like keeping people employed and hitting the Party's targets. They probably won't be starting any new capacity additions, but it will take a long time to work out the existing amount. In the meantime the state owned banks will extend credit to cover their losses.

Longer term, the outlook is not that bad. Aluminum is heavily used in aerospace and is increasingly used in automobiles and trucks. These are growth areas. It is also used in general infrastructure, which will probably continue to grow moderately. So the issue is how long till the excess supply gets worked off. Alcoa has said publically that it expects its aluminum demand to grow by 7% per year. This may be overoptimistic for the industry as a whole; Alcoa serves the fast growing aerospace and automotive industries. Nonetheless, this is going to take awhile.

So how and if should one invest in this. The simplest way would be to buy aluminum metal and store it. Off LME exchange carrying costs are quite low. If aluminum can get back to its long term deflated average in five years, it will give a return of just under 10% per year. To my mind, that's not worth the risk.

Another way would be to invest in a western aluminum company that is likely to survive the low prices and emerge profitable when they go back up. Alcoa is an obvious candidate here. Its downstream business is quite profitable and is going to be spun off later in the year. Note though that this is more of a play on the fabricating and casting business than a pure commodity play. 

In times of low prices, I always think it's best to buy the low cost producer. The lowest cost publicly traded producer is probably Rio Tinto, but aluminum is not a majority of their business. Behind it comes Rusal (Russian) and Norsk Hydro (Norwegian), which are more pure plays. If you are willing to take the  Russian political and governance risks, I would go for Rusal.

I have a very small position in Alcoa preferred. I would add the common stock if got into the low 8s.


Wednesday, October 21, 2015

POST 3

A theme one often hears in the commodity markets is the coming shortage of arable land and food supplies. The argument goes like this: World population continues to increase. Additionally, the exploding middle class in emerging markets (EM) like China and India now have the income to shift from a traditional diet to a developed market (DM) diet high in meat, fats and sweets. (More accurately that’s really a northern European/US diet rather than full DM).  In 2014 people in EM only consumed 44% of the meat per capita as DM. Meat takes much larger agricultural resources per pound than the traditional diets. Meanwhile new agricultural land is limited in extent and marginal in productivity. Yields per acre are still increasing, but at a slower rate. This will get worse as most of the easy gains have been made. Climate change may accentuate the problem.

I believe the above argument is wrong. It is a classic case of narrative vs. data. The numbers simply do not support the argument. In fact, one could make just as strong a case for a chronic agriculture oversupply, especially if the political supports for products like ethanol are eliminated. I won’t make that case, but I will debunk the shortage.

First let’s look at agricultural supply. It is true that the growth in yield per acre in the developed nations have decelerated to under 1% per year (although still increasing). But the same is not true in EM. Here’s a graph of yield per acre:


Note how total world yields increases have been remarkably stable for a very long time, except for the droughts in N. America in the 1980s. EM yields are still rising at over 2.5% per year. Combined with a small (about 0.2%) increase in land under cultivation, this will be enough to comfortably feed the world’s increasing population. Of course there are risks. Climate change may decrease (or increase) yields. War and general geopolitics may take land out of cultivation. Anti-technology advocates may restrict improvements in farming practices. But the base case is for continuing growth in food production.

Now let’s look at the demand side. A key fact here is that the demographic bust well known in developed economies has spread to EM. The United Nations predicts that world population will grow by only 0.9% per annum in the next 20 years. After that they predict a slow decline towards zero population growth. Note that this is an extremely important statistic for many industries besides food.

Second, there is good reason to believe that the EM population will never consume a northern European-US style diet. This may come as a surprise to many, but the diabetes problem in China is worse than in the US. According to a 2013 AMA report, 11.6% of Chinese adults are diabetic (vs. 11.3% in the US). Additionally, 40% of 18-to-29-year-olds in China are on the verge of developing the disease. This is a result of changes in diet and physical activity. It is taking place with meat, fat and overall calorie consumption levels that are far lower than in the US, and it possibly has a genetic component. The situation in India and southern Asia is progressing along the same lines but at an earlier stage.

I believe this will play itself out similarly to smoking. Fifteen years ago, China was considered the big growth market for tobacco. The government launched a spate of anti-smoking measures, and the tide is now turning. As time goes on, we will likely see a stream of healthier diet initiatives, and the tide of increasing meat consumption will also recede.

As much I dislike arguments from authority, I will point out that the USDA agrees with me. Its price forecasts for the major US agricultural products like corn, wheat and soybeans are pretty much flat for the next ten years.

It’s important to stress that I am talking about overall agricultural supply and demand. There will be many sectors of the market that will do very well. I especially like more expensive and reasonably healthy sectors like fruit, tree nuts and farmed fish. As an example, many Chinese have recently developed a taste for pecans, almost all of which are grown in the US. This has led to significant price increases and substantial profits for the US industry.

I’ll get to the specific investments in the sector that I own in future posts.

Saturday, October 17, 2015

THE LONG RUN 2

POST 2


This post continues the theme of the last post. So I recommend you read that before reading this.


I’m going to try to get a quantitative estimate of the returns we might expect from commodities as an asset class. Actually I’m going to try to predict the value of an index of commodity prices in ten years. Why ten years? Because I don’t have a clue of how to predict at short horizons. With the financialization of commodity assets (we will get to that in a future post) the shorter term is basically a matter of psychology and the progress of world economic growth. Who knows that? Over ten years fundamental models do work rather well, as we will see.


Awhile back I read a study by Vanguard that used a number of methods to forecast equity prices. Interestingly it came to the same conclusion: you have to go out ten years or so to have reasonably good results. It also found that the best predictor was valuation. So if you buy when stocks sell at a low price earnings ratio, the odds are pretty good that you will do well over the next decade. We are going to do more or less the same thing with commodities.


Here is a chart that illustrates what I mean. I’m going to use this type of chart a fair bit, and you may not be familiar with it. So here is what I am doing: The horizontal axis is the price of the commodity index in 2015$. The vertical axis is the forward ten year return. So a dot on the graph, say from June 1999, is the price on June 1999 and the change in price from June 1999 to June 2009. Obviously this stops in October 2005, since I don’t know forward ten year returns from then on.


graphPost2.1.jpg
The graph looks pretty much like it should. As the commodity price index goes down, forward return goes up. It’s not a straight line; at very low levels of the price index, the return gets much higher. If you plot it on a double log scale, it is straight. The major outliers on the graph are during the period 1984 till 1992, when the forward return was lower than expected. My guess is that’s because the lingering effects of the great inflation of the late 70s took more than ten years to wear off.


Right now we are at 102 on the horizontal axis. This give an expected return of about 40% over the next ten years. Note that this is a constant dollar return. So if you expect inflation to run 2% a year, the total return would be 64%. From that you would have to subtract carrying cost (contango) or add in backwardation (not likely). The total return would be positive but not outstanding, maybe 3% per year. That’s what I mean when I said in the first post that commodities were somewhat cheap, but not a screaming buy.


If you want to do a little advanced statistics, you can get a somewhat better fit. I have done it although this is not a place to go into the technical gore. The forecasted return gets a little better, from 64% to 74%.

Next Post: The emerging market middle class and the myth of an agriculture shortage.

Wednesday, October 14, 2015

THE LONG RUN

 POST 1 - THE LONG RUN

The question for the first few posts is “are commodities cheap?” They are certainly cheaper than a year ago. But we are going to start out with a very long term view. The longest commodity price index I know is the US producer price index for crude materials. Here’s a graph going back to 1947:

Important note: In these posts I will normally use the IMF all-commodity index as a baseline. This is a very broad-based index of 53 commodities. Many of them do not have active futures markets. Nonetheless they are all economically important, and are all investable via equity or debt markets. However, this index only starts in 1980. So I spliced the IMF series to the crude PPI.


The chart is mostly flat prior to 1998 with the exception of the inflation in the 1970s. Around 1998 it started rising again, but with much more volatility. The inflation in the 70s was both a reaction to macroeconomic cost push inflation, the cartelization of important commodities and prior underinvestment. The rise since 1998 is more due to unexpected emerging market demand as well as cheap credit.

Of course with a series as long as this overall inflation really does matter. Here’s the same graph in constant 2015 dollars.


The pattern here really is different. It essentially shows a continuous decline in real commodity prices until 1998, interrupted only by the oil shock of the early 70s. After 1998, I will argue that the sharp rise until 2008 was the result of both unexpected EM demand and a credit bubble. Since 2008 EM demand has slowed and the credit bubble is slowly deflating.

Here are some numbers. The average deflated price of the index over the whole period is 131. We are now at 102. That is almost exactly one standard deviation below average. On this basis, commodities do seem cheap.

But wait. Many economists claim that commodities should slowly decline relative to overall inflation. Commodity production is subject to the increasing productivity of human innovation. In the rest of the economy much of the service sector has stagnant productivity. Think of government, education, and health care. This is in fact what happened until 1998. If we assume the last 15 years have been an anomaly and extrapolate the 1947 - 1998 trend to now, the number comes out to be 41. That’s two standard deviations below where we are now. In this argument going long commodities is betting against human ingenuity.

There are some good counterarguments to this. Many commodities, including some important industrial ones, are subject to depletion. We see this vividly in the current oil market. The new supplies of oil from shale and oil sands are definitely a product of human ingenuity. But they come at a higher price than supplies from traditional reservoirs. Energy from renewable sources is more expensive yet. All this points to an upward trend.

I have another counterargument. Services are more labor-intensive than commodity production. That’s why service productivity growth is low. As long as labor was the scarce input it was reasonable to expect that service prices would rise relative to commodities. But labor is no longer scarce. Globalization and immigration have expanded the pool of labor. Unemployment and underemployment are elevated in most developed countries. So we have a larger pool of workers offering services and bidding for commodities.

My own view is that commodities in general are somewhat cheap. Not enough to be a screaming buy and not enough to offset the contango in hard-to-store markets like natural gas. Nonetheless, they are generally a buy. As this blog progresses, I will give my view on what exactly is cheap and ways in which they can be invested in.

NEXT POST What is the expected return from commodities at current levels?